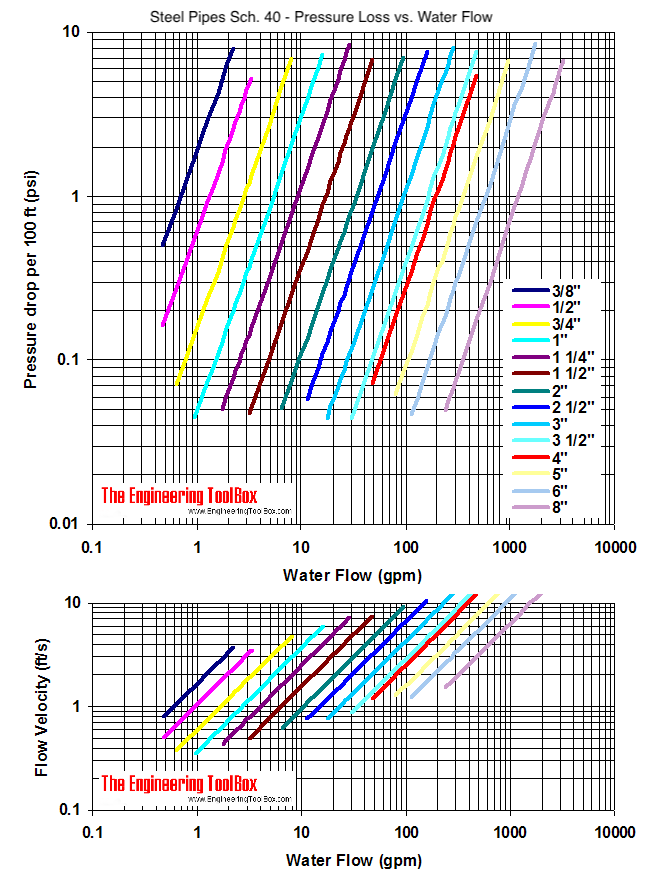
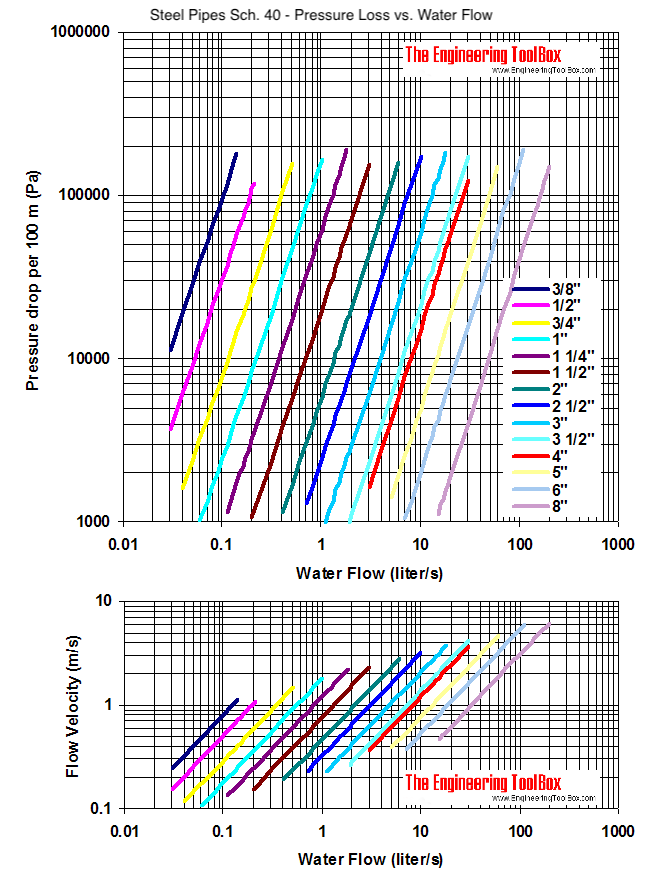
Steel Pipes Schedule 40 - Friction Loss vs. Water Flow Diagram
Friction loss and velocity diagrams - in imperial (psi/100 ft, ft/s) and SI (Pa/100m, m/s) units.
The diagram below indicates friction loss for water flow through ASME/ANSI B36.10/19 schedule 40 steel pipes.
The pressure drop calculations are made with the D'Arcy-Weisbach Equation.
- Fluid : Water
- Pipe : Steel Pipe - Schedule 40
- Temperature : 20.0 oC (68.0 oF)
- Density : 998.3 kg/m3 (62.0 lb/ft3)
- Kinematic Viscosity : 1.004×10⁻⁶ m2/s (0.01 stokes) (1.08E-5 ft2/s)
- Pipe Roughness Coefficient : 4.5×10⁻⁵
Pressure Drop - Imperial Units

- 1 gal (US)/min =6.30888×10⁻⁵ m3/s = 0.0227 m3/h = 0.06309 dm3(litre)/s = 2.228×10⁻³ ft3/s = 0.1337 ft3/min
- 1 ft/s = 0.3048 m/s
- 1 psi (lb/in2) = 6,894.8 Pa (N/m2) = 6.895×10⁻³ N/mm2 = 6.895×10⁻² bar = 27.71 in H2O at 61 oF (16.7 oC) = 703.1 mm H2O at 61 oF (16.7 oC) = 2.0416 in mercury at 61 oF (16.7 oC) = 51.8 mm mercury at 61 oF (16.7 oC) = 703.6 kg/m2 = 2.307 Ft. H2O
Pressure Drop - SI Units

- 1 Pa = 10-6 N/mm2 = 10-5 bar = 0.1020 kp/m2 = 1.02×10⁻⁴ m H2O = 9.869×10⁻⁶ atm = 1.45×10⁻⁴ psi (lbf/in2)
- 1 liter/s = 10-3 m3/s = 3.6 m3/h = 0.03532 ft3/s = 2.1189 ft3/min (cfm) = 13.200 Imp.gal (UK)/min = 15.852 gal (US)/min = 792 Imp. gal (UK)/h
- 1 m/s = 3.6 km/h = 196.85 ft/min = 2.237 mph
A table presentation of the diagrams above: "Steel Pipe Schedule 40 - Friction loss and Velocities".


